
Neirbi Analytics
A geolocation based application for making travel decisions based on weather, events and traffic patterns
Project Summary
The founders of Nearby Analytics approached me to have them build out the UI of their MVP - a web based application that alerts users with relevant geo-targeted events that could have positive or negative effects on their business.
The issue at the time was there was no centralized application that could easily take into account various threats locally (weather, events, traffic patterns) that could impact a business’ day to day operations. The Neirbi team wanted to create a dashboard that could serve as an internal alert system that could predict and warn users in advance of a potential disruption to business operations.
The Process

Research
Over a 4 month period, I led the UX design process to build the Neirbi Analytics tool. First I started with the user in mind - after conducting interviews with local hotel branch managers - I created a persona of what a typical user would look like. His name is Hugh, the hospitality manager of a hotel located in the Greater Boston area. Below you’ll see that I used research to state his goals, frustrations, motivations, personality and working style.

Design
First I started with a user journey map, a flow that would help illustrate what the ideal steps would be from start to finish that would make it as easy and streamlined as possible for a user to take advantage of the features of the Neirbi Analytics tools in concept.

A user journey of the Neirbi website outlining the navigation and touch points to access key features of the platform
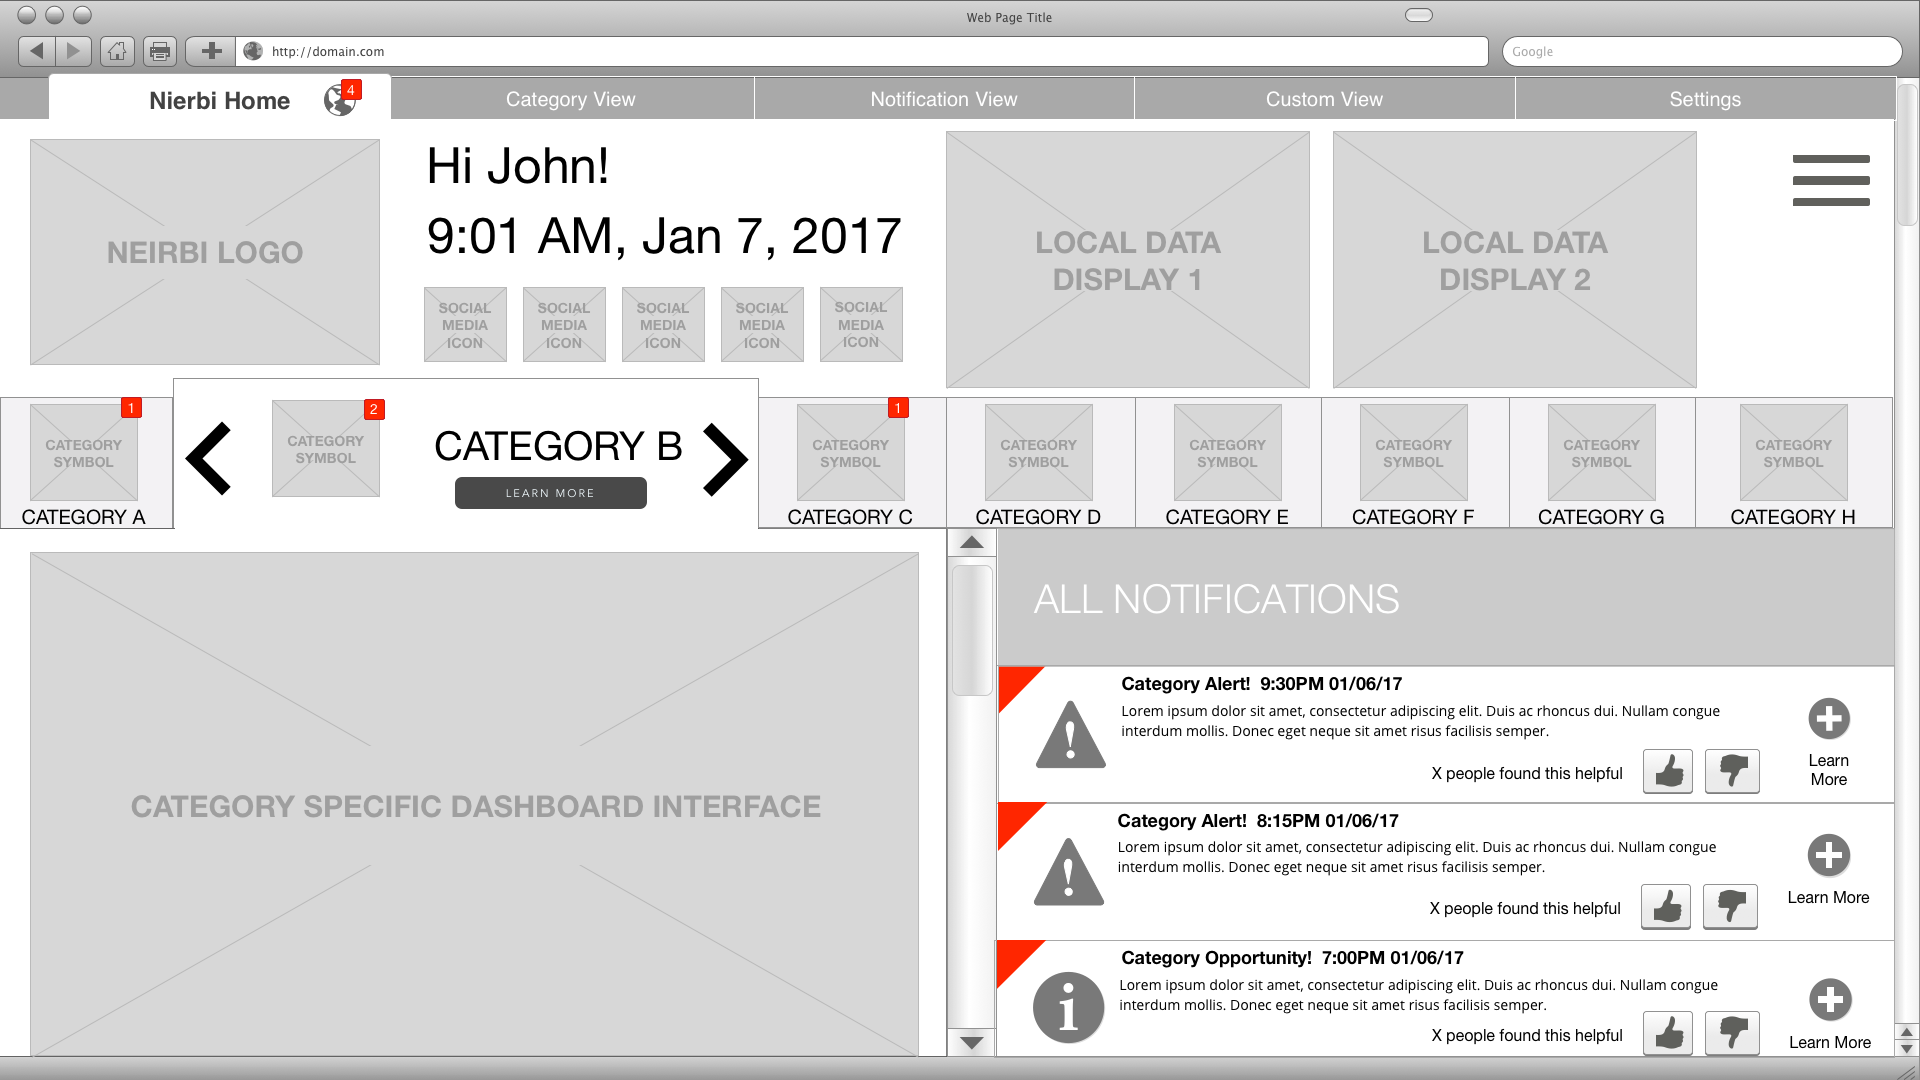
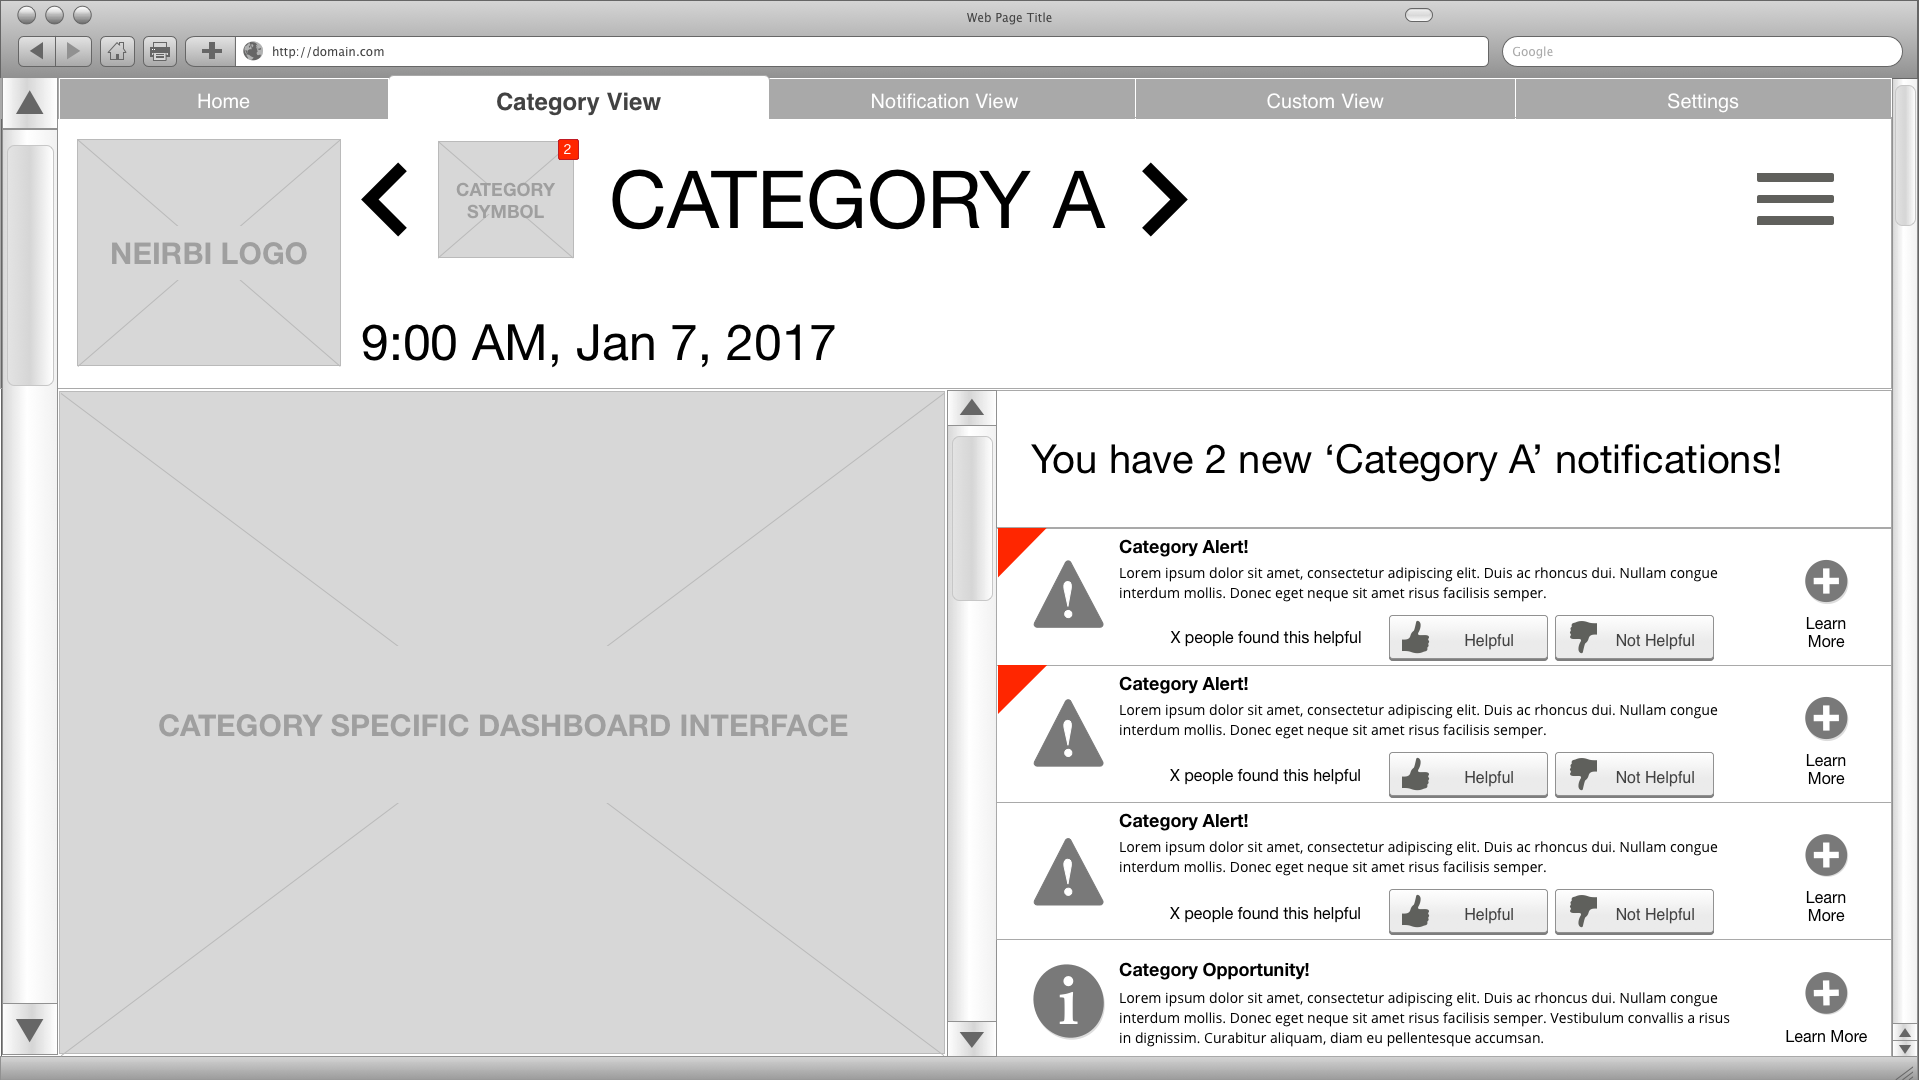
Utilizing the research conducted and information architecture established above, I then created low fidelity wireframes for the entire Neirbi analytics platform.
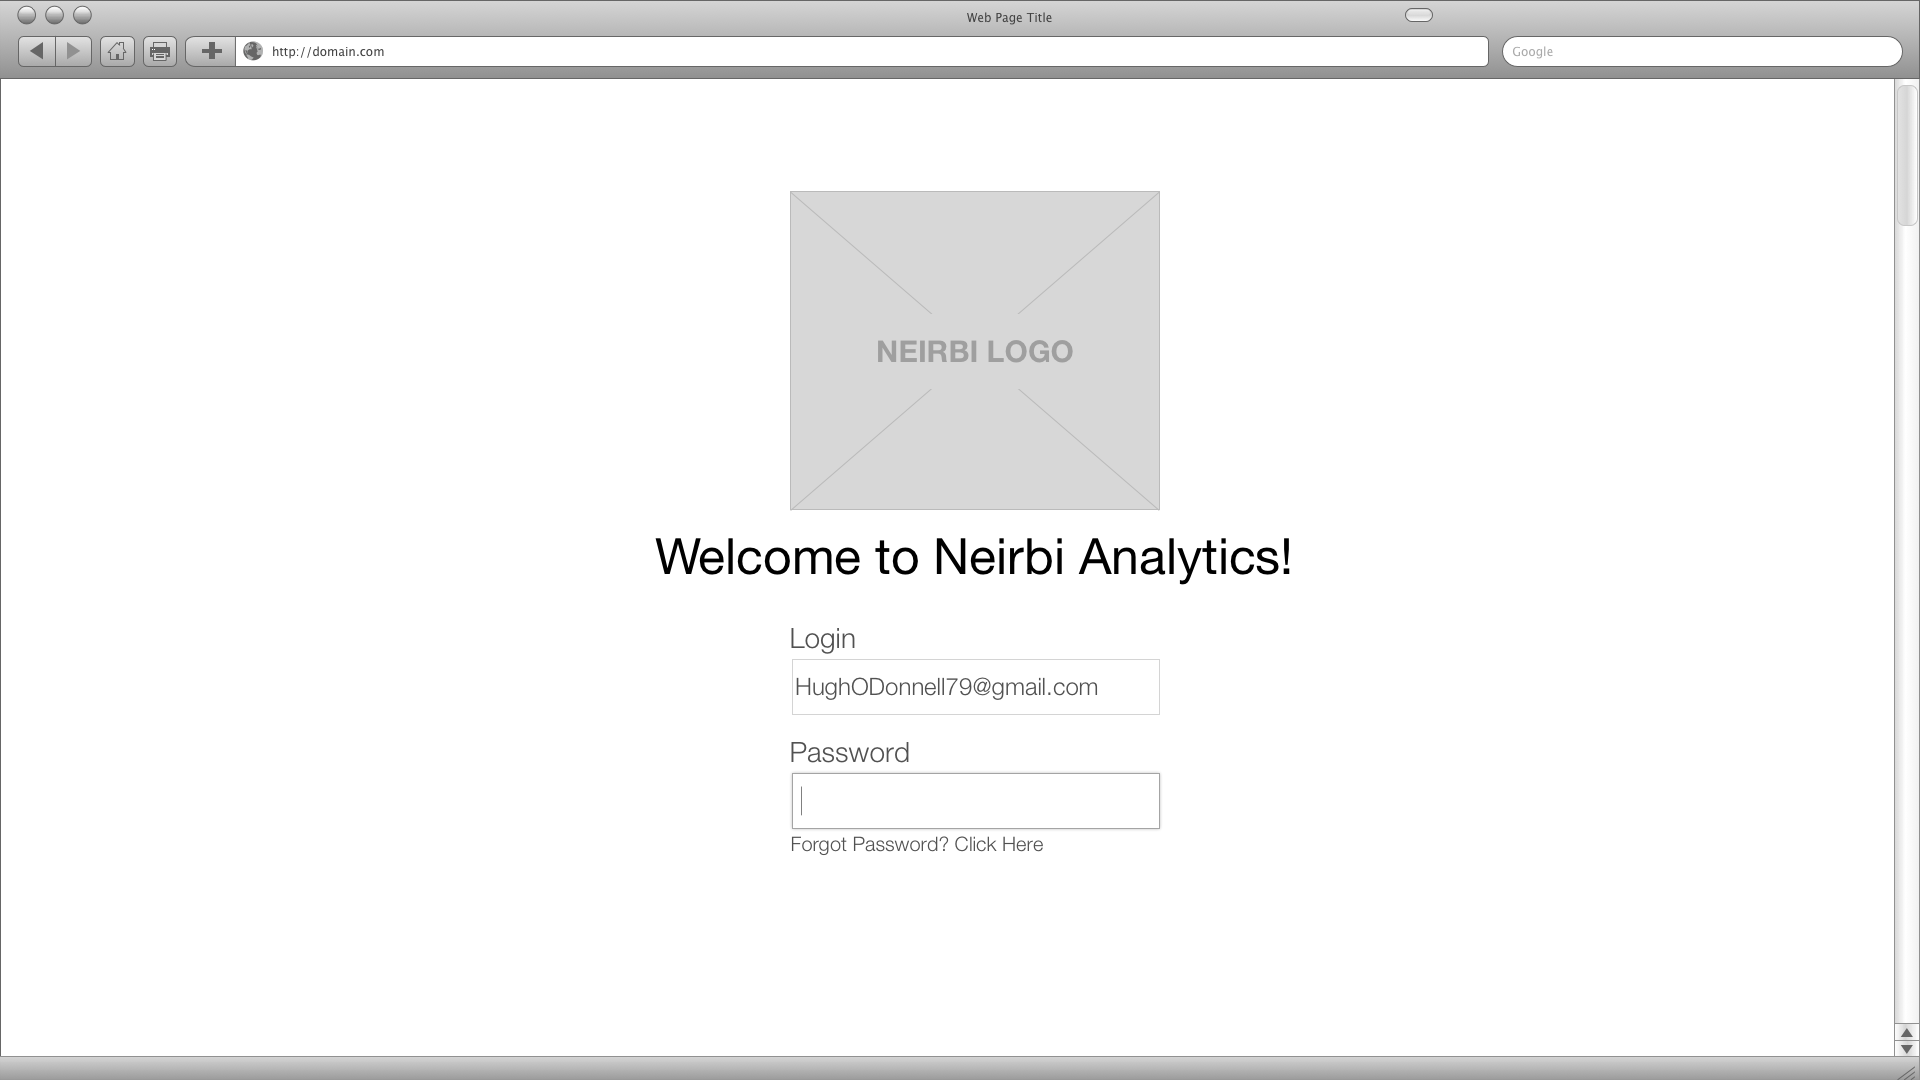


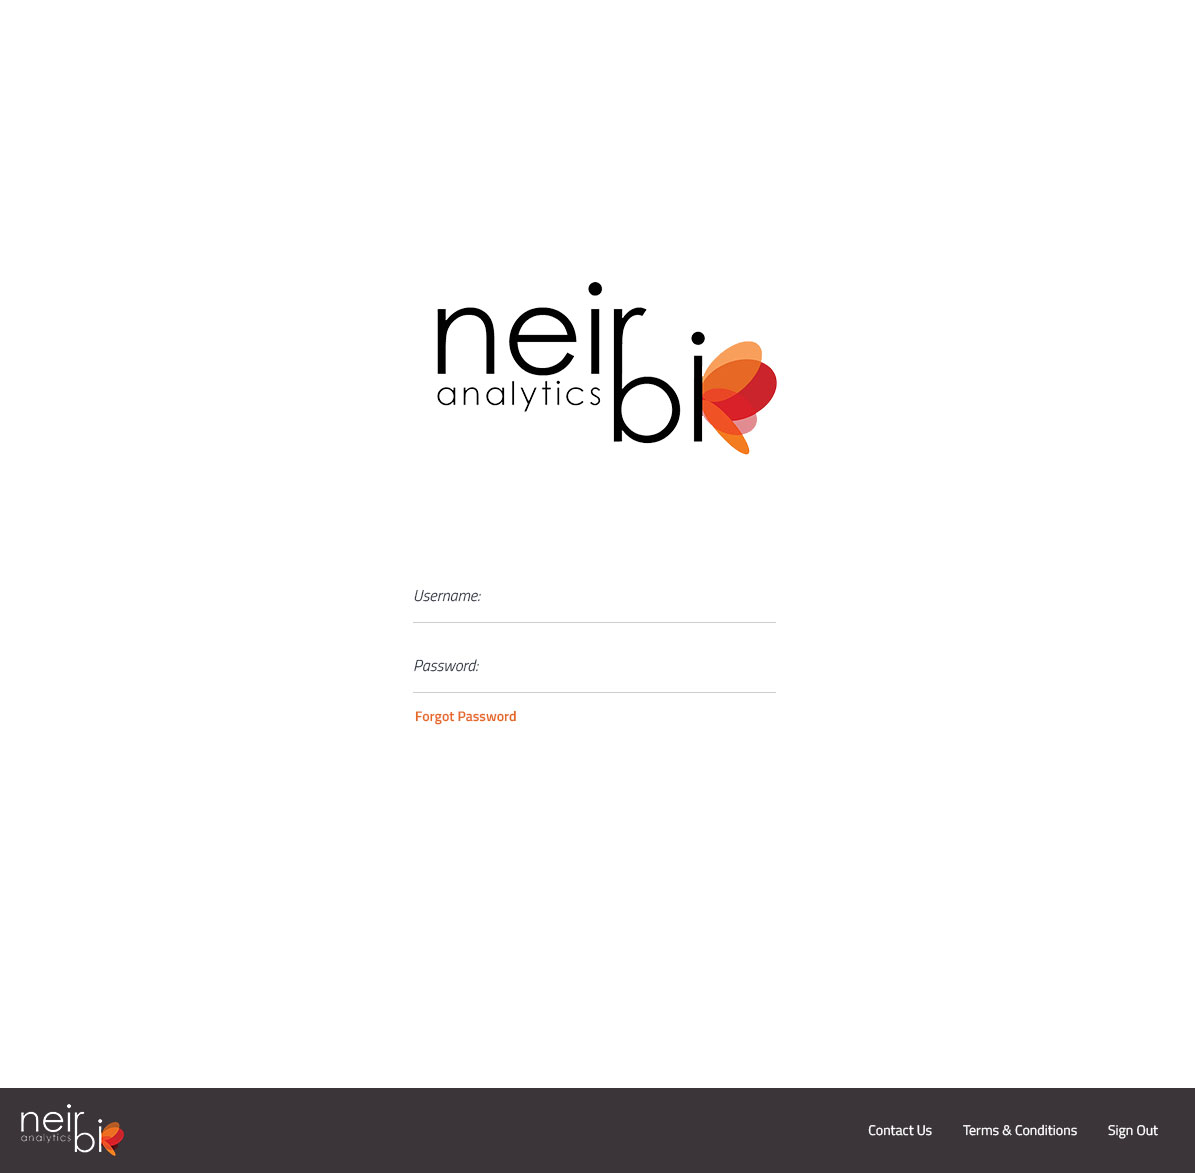
Prototype
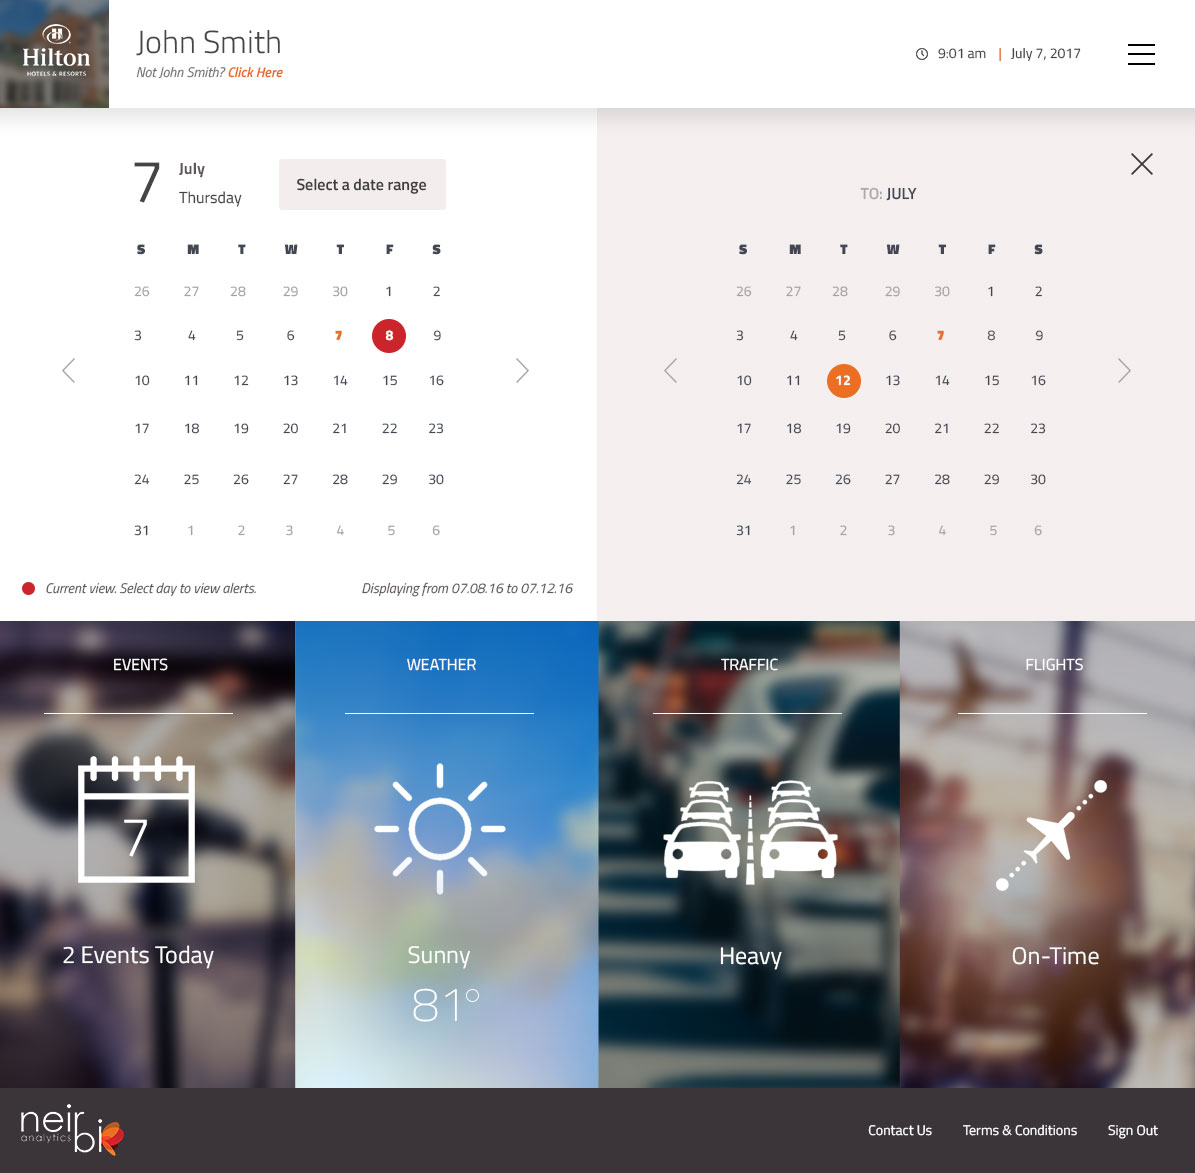
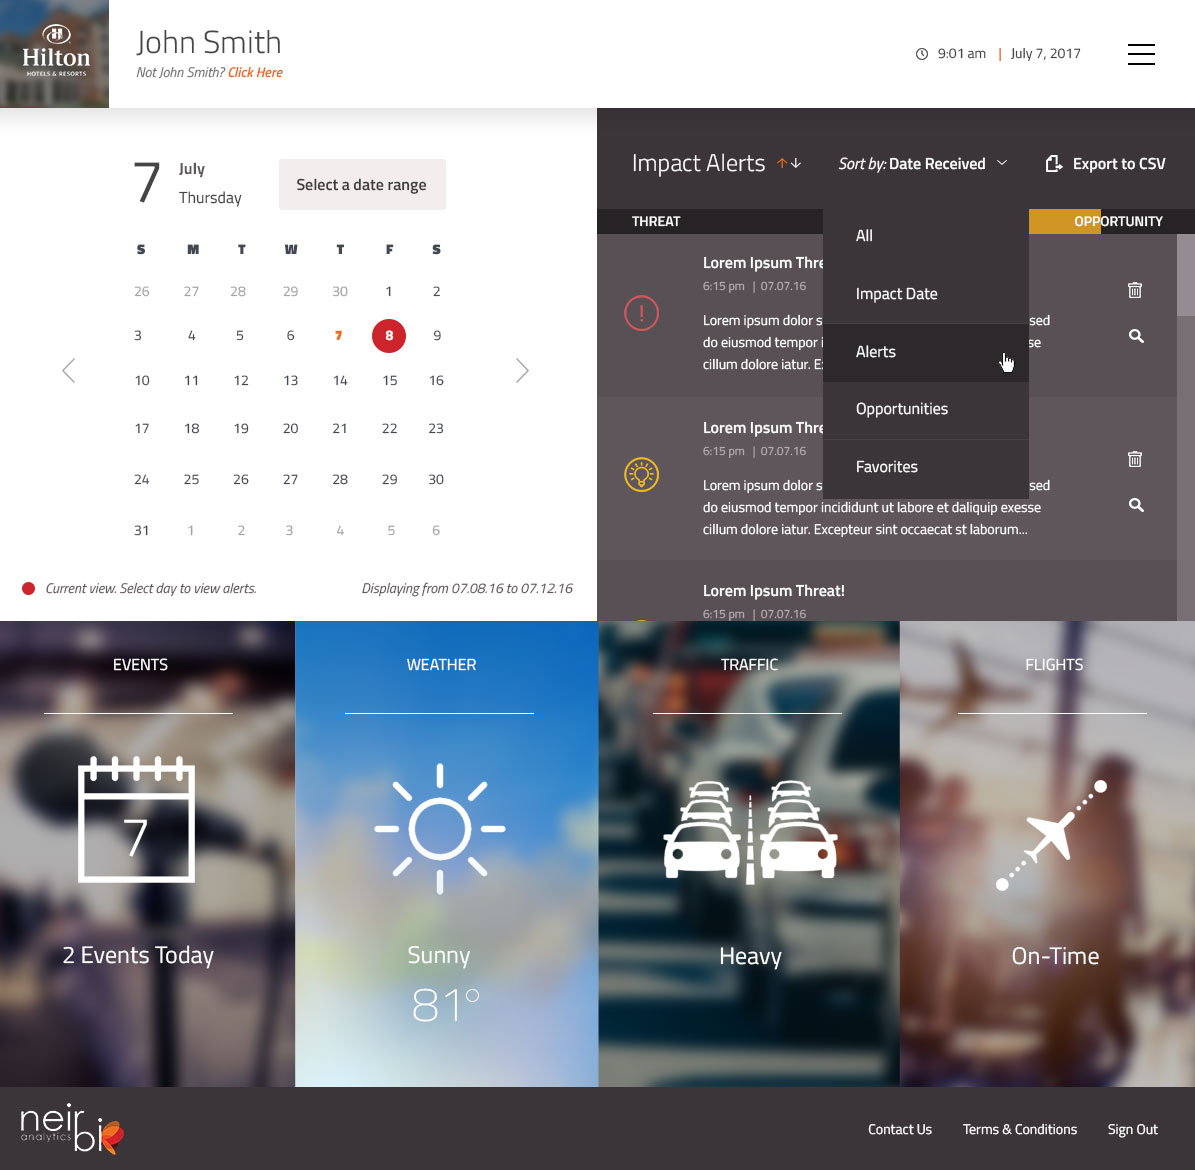
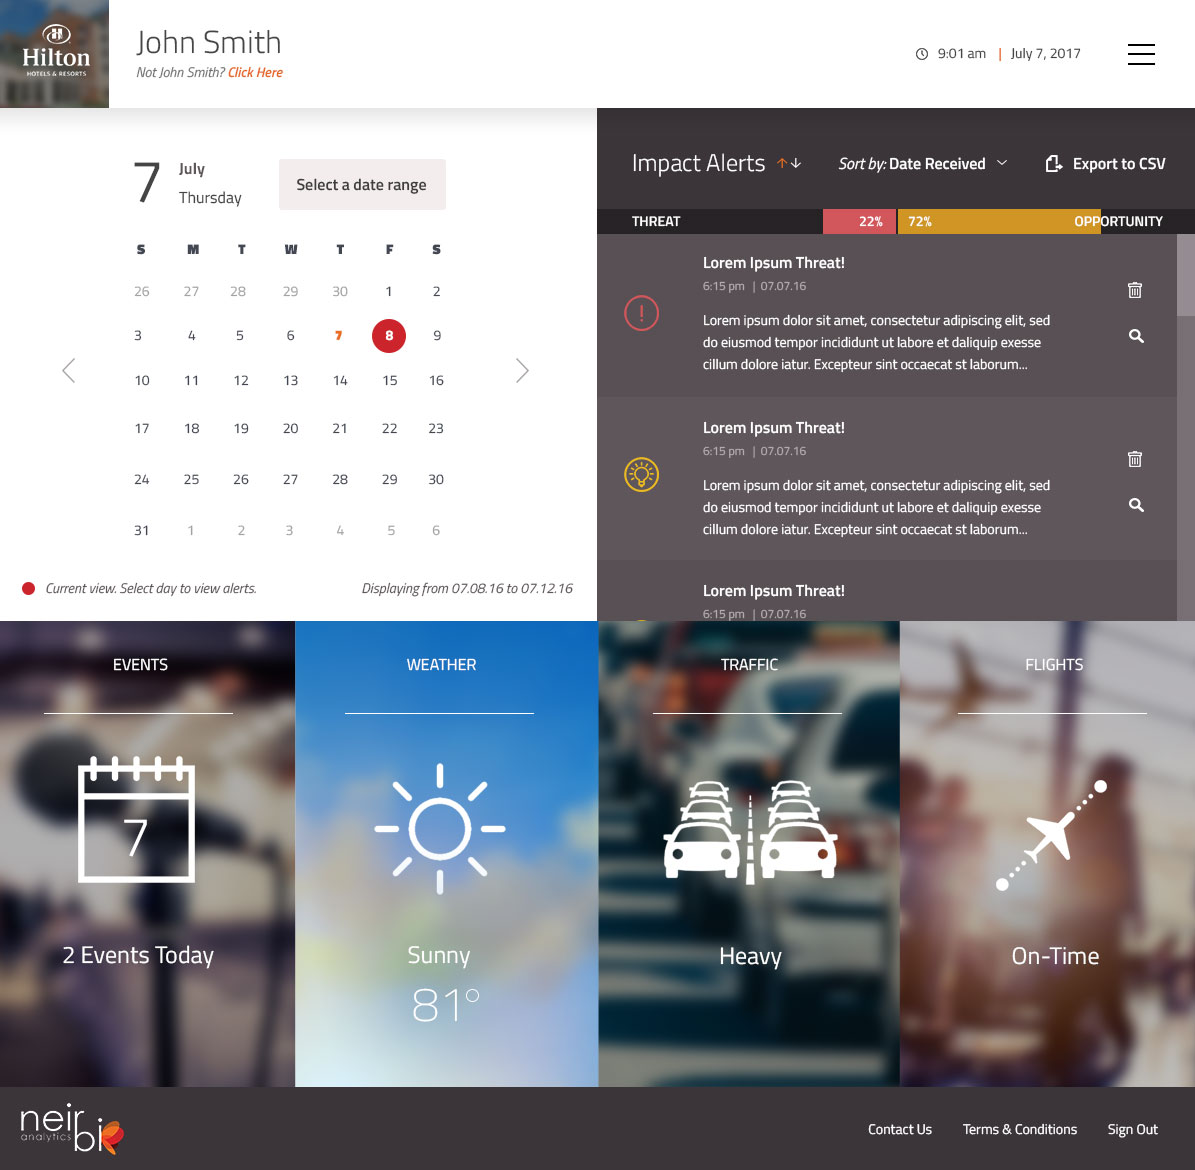
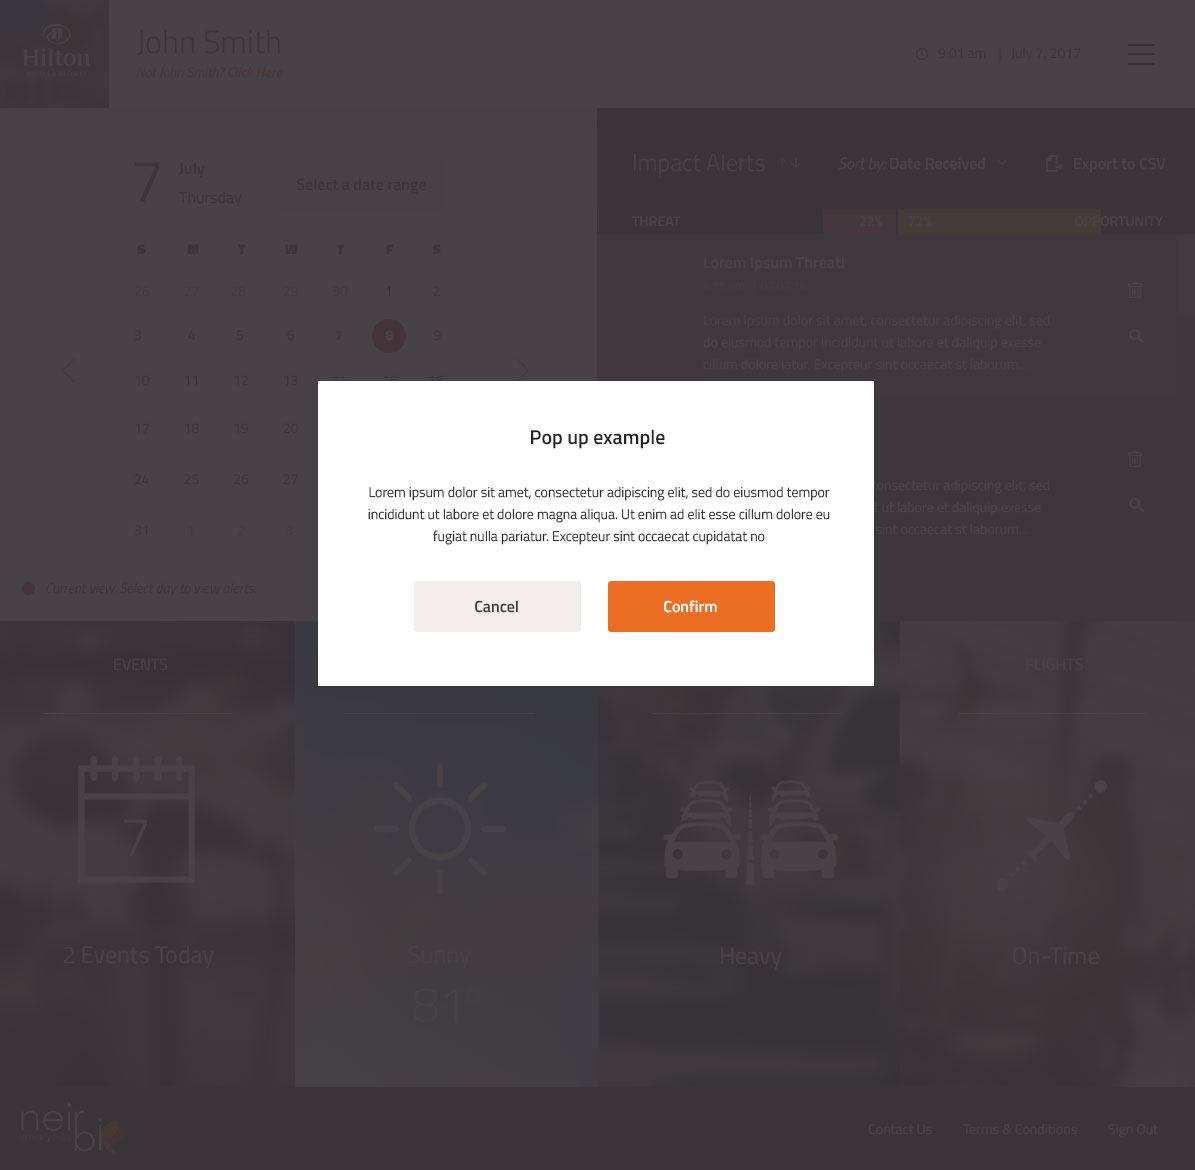
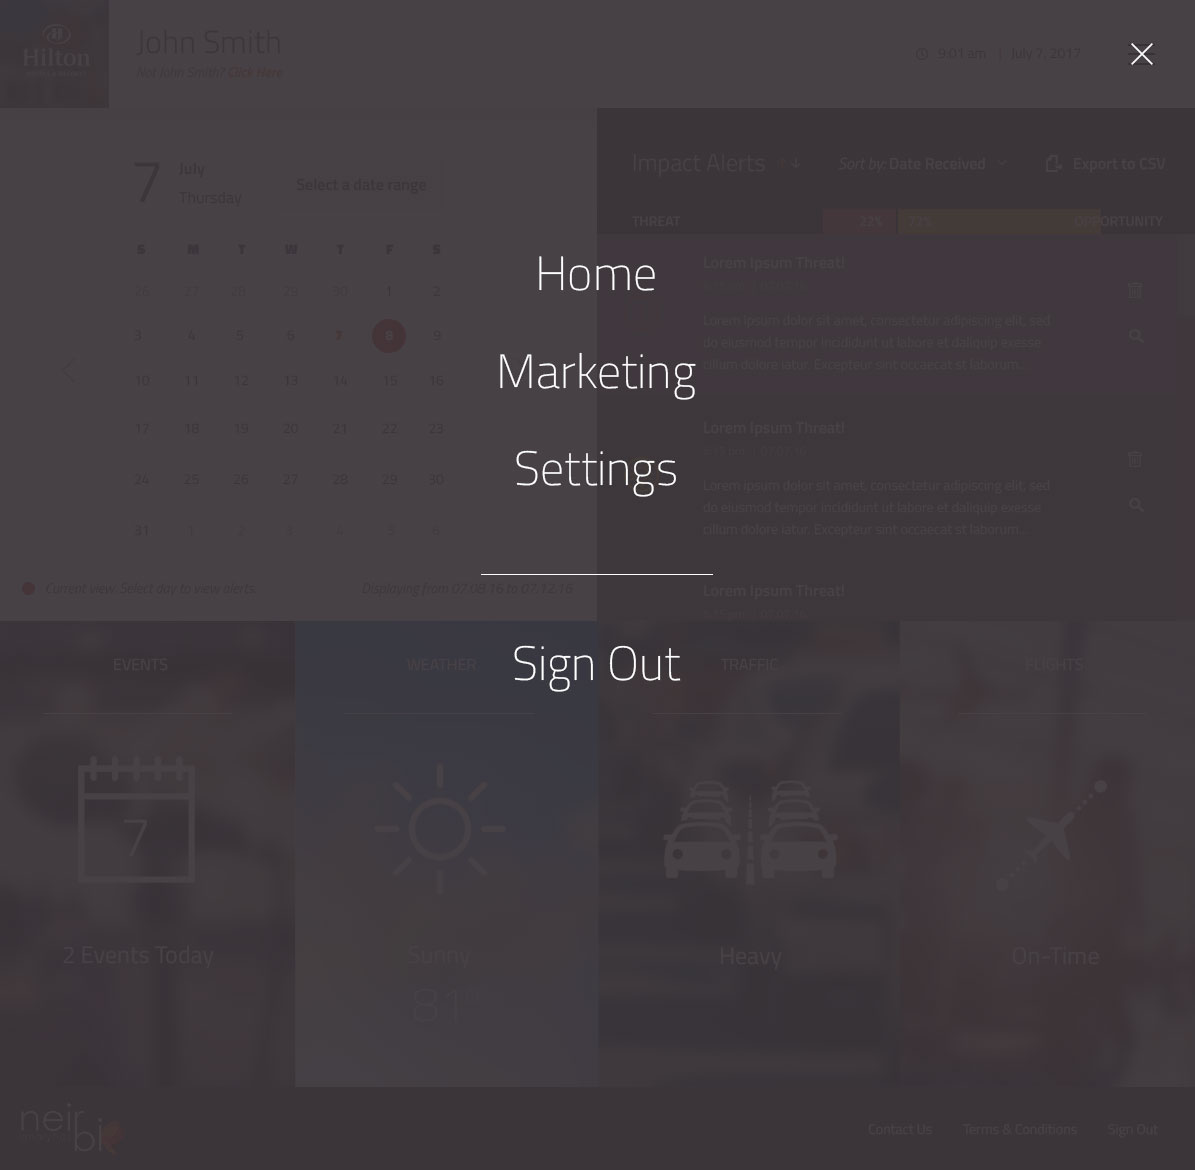
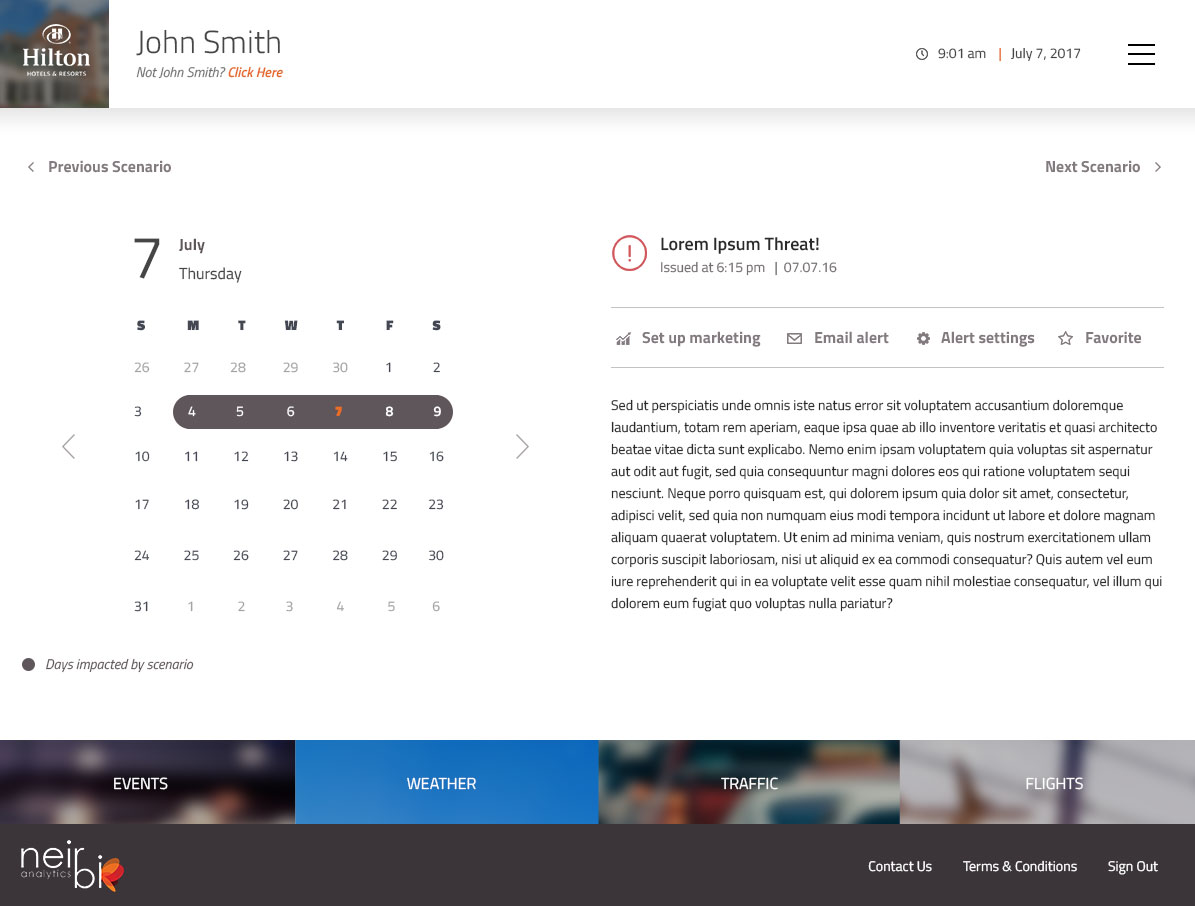
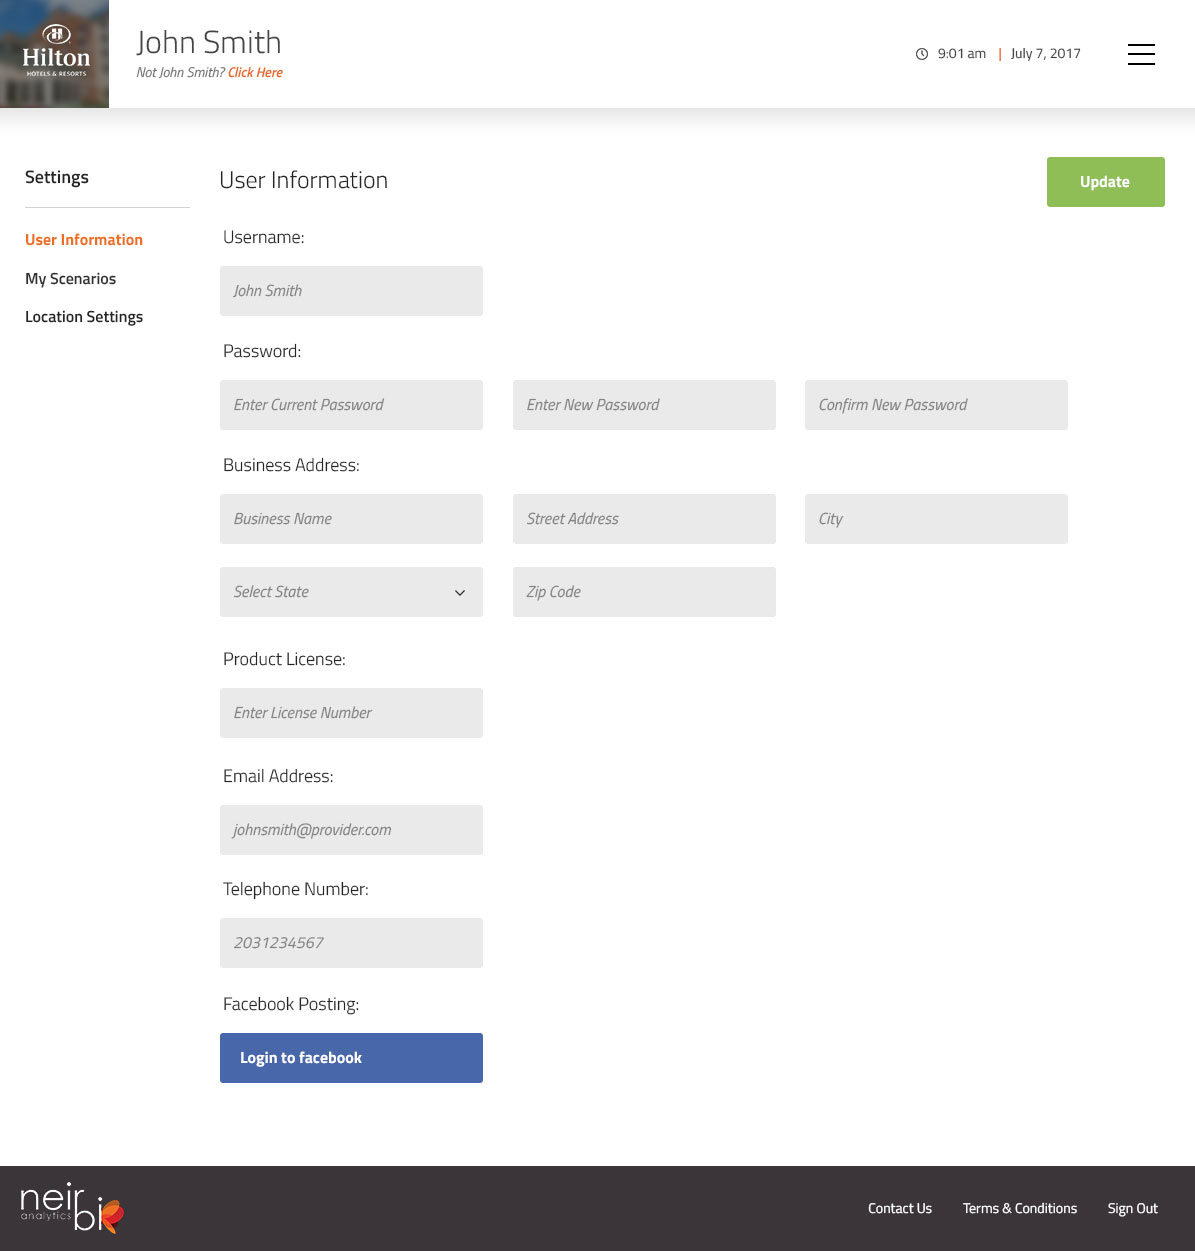
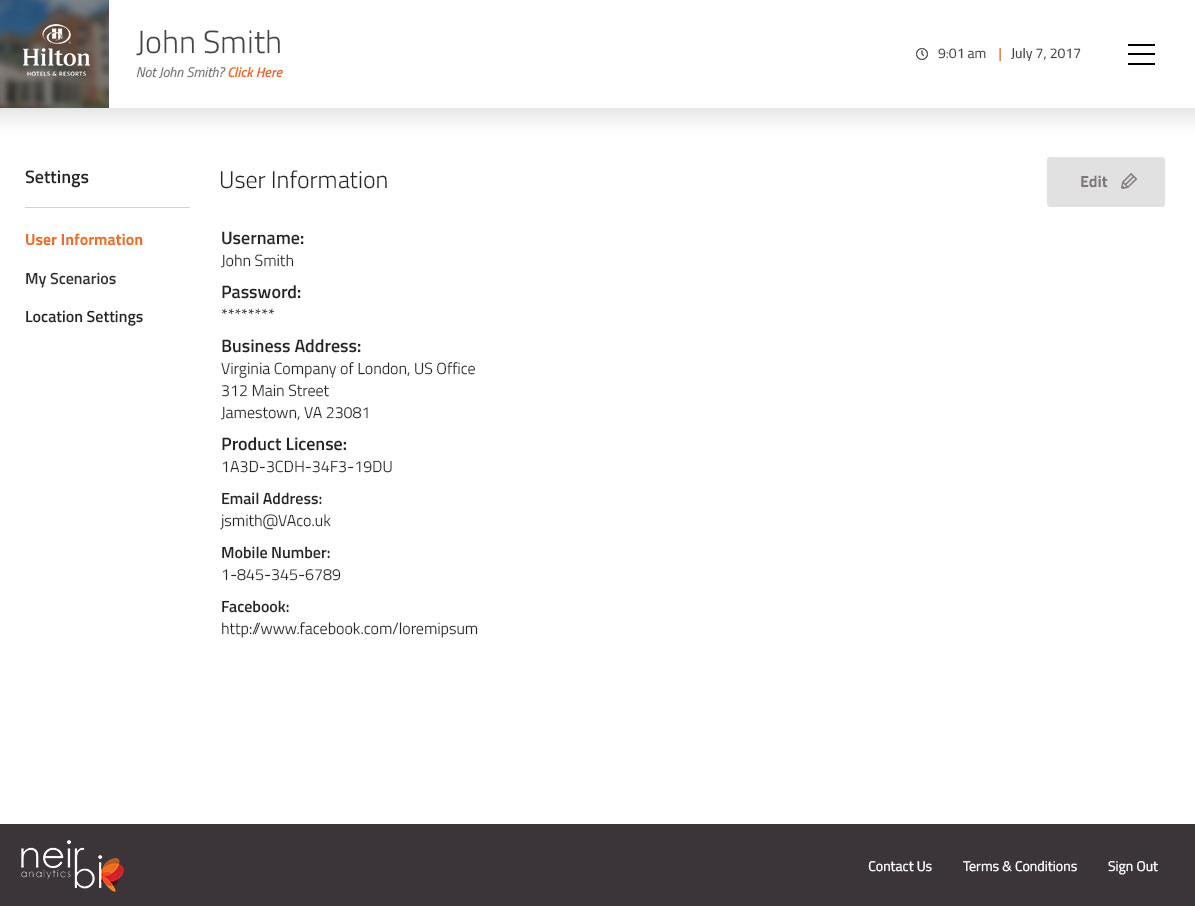
Following several design iterations, the Neirbi Analytics application went through the process of being fully branded designed for development. Below is the end result showcasing the process of logging in as a user, creating a profile, managing settings and then interacting with the dashboard to manage alerts of inclement conditions that could effect business in the future.
This was then passed off to the the client who then implemented this tool utilizing their own developers.


Project Duration
4 Months
Role
Lead UX Designer
Tools
Xtensio, Lucid Chart, Invision, Photoshop, Illustrator, Axure